
price action chart patterns pdf.
In this article we will see the best price action chart patterns in detail also we will see some stock example that gives the best returns after breakout stock.
Here Are price action chart patterns
- Triangle Pattern
- Ascending triangle
-
Descending triangle
-
Triangle Pattern
The triangle pattern is a bullish or bearish pattern.in this pattern, we create or draw two trendlines and after the trendline breakout the market gives a huge return.
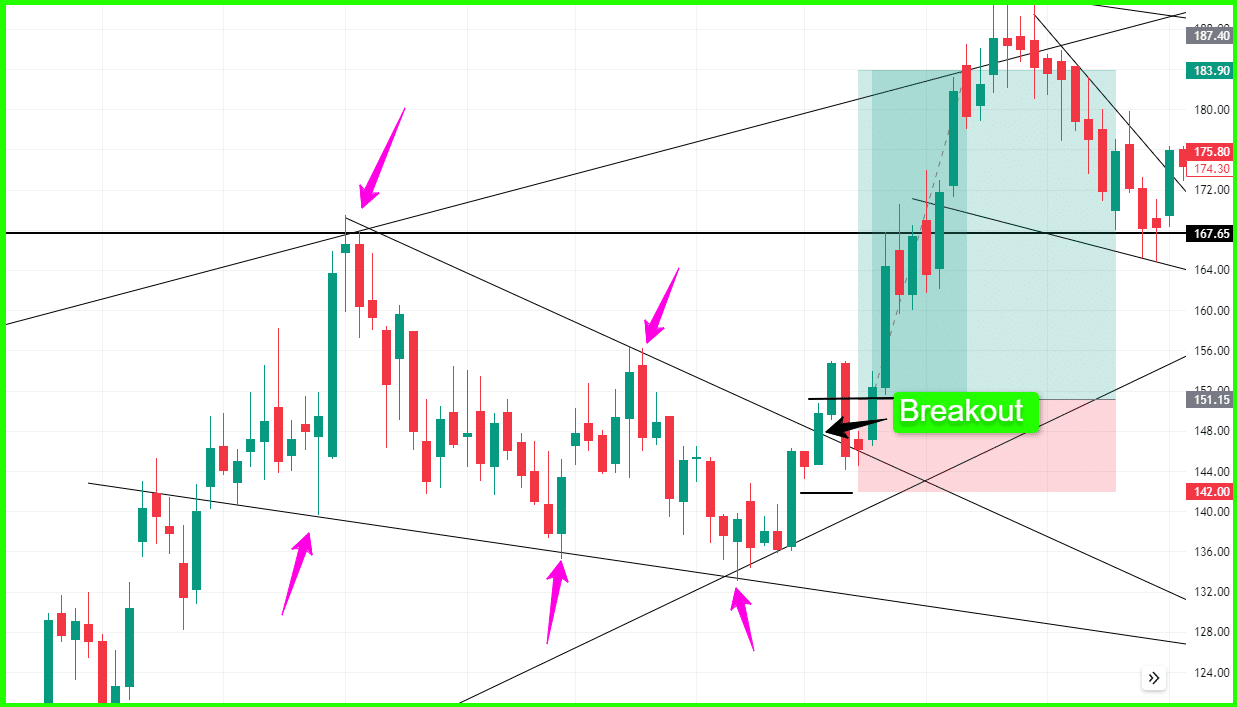
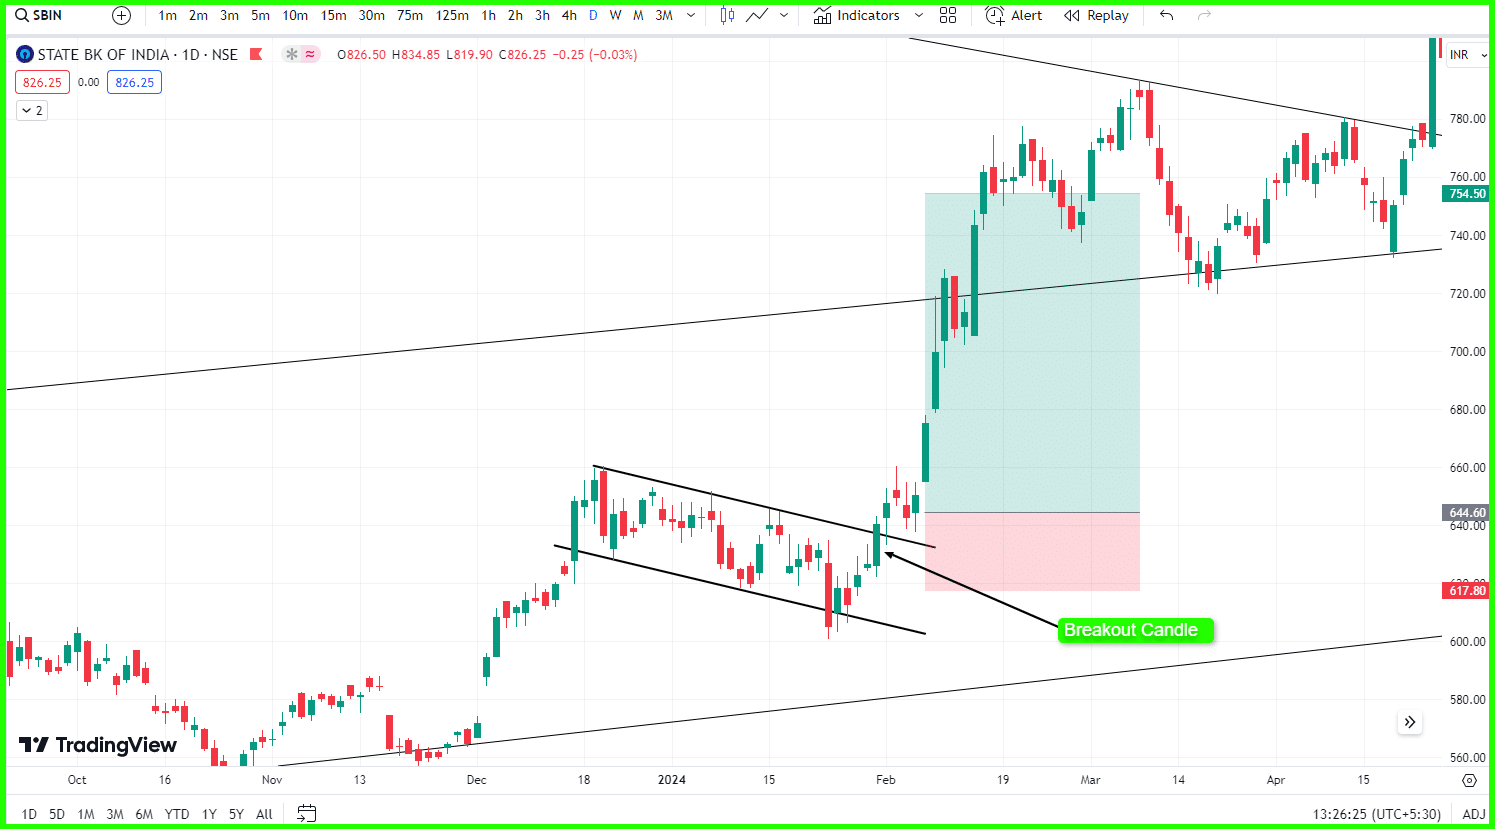
In this image you can see that I draw Trendline and market respect the trend line and when market touch the trend line and then market reverse but I mention break out candle and this break out candle you can see that after break out you take entry and put stop loss below the previous swing and then if I see that market not break down the previous swing and market goals up and gives nearby one as two three risk reward ratio but this type of pattern you can find with experience and also the market condition and draw trend line perfectly.
Read Also This
–Tata Motors Share Price Target
–Adani Power Share Price Target
-Adani Total Gas Share Price Target
-Reliance Power Share Price Target 2030
Friends see the above image. In this image, I draw to trend line with black colour, and below train line market take 3 Times support and about landline Market take two times resistance but Third time you can see that I mention a break out candle and once the candle break out the upper trend line then we take entry after this candles high will break but before take entry you should know where I will put my stop loss in this situation you can put your stop loss break out candles previous swing and I mentioned previous swing with horizontal black line and you can see that after market goes upside from break out candle then how returns you got. This strategy is very simple and everybody can deploy it but before taking entry you should know the market situation and also before taking entry please take your own risk means calculated because nothing is 100% accurate in the stock market.
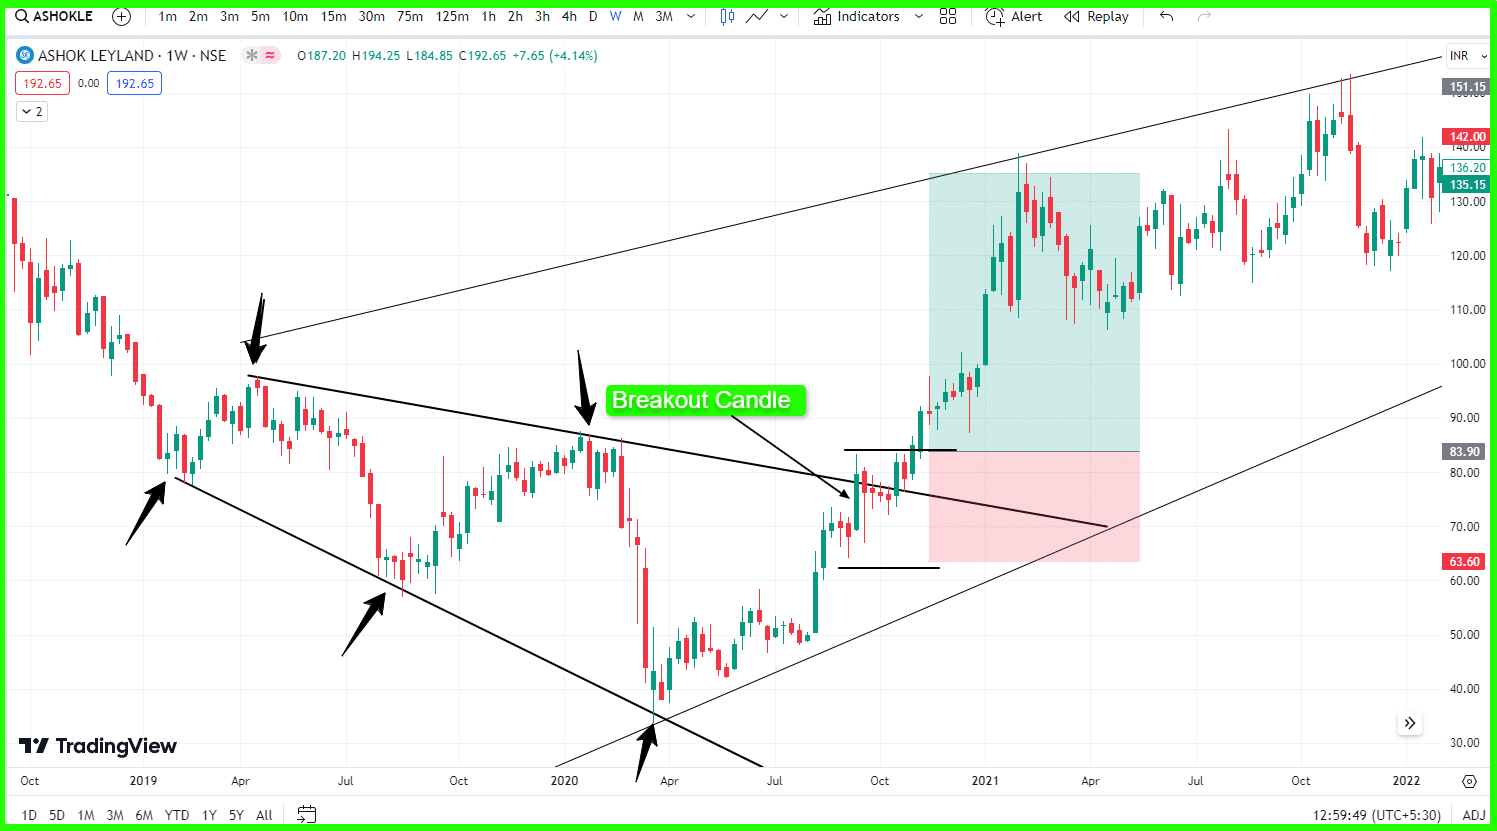
Friends let’s see the upper image Hindi image I draw to trend line and again you can say that after break out Upper trend line I take entry after break out the break out candle and put stop loss below the previous swing and then you can see that how the market cubes reward so that you need focus on correct pattern and also if the market on big time frame bullish and then you can find on small time frame bullish pattern.
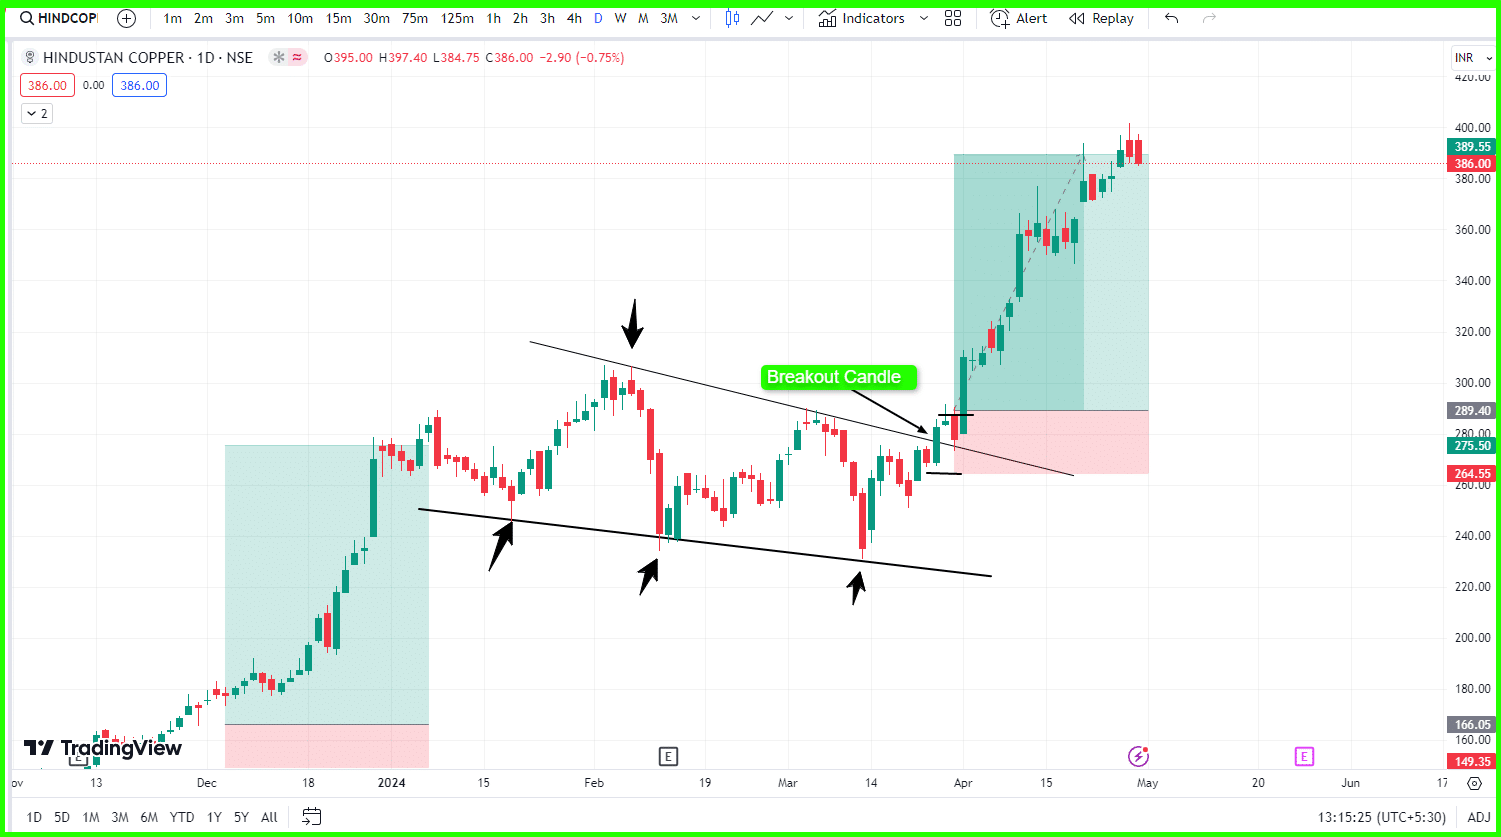
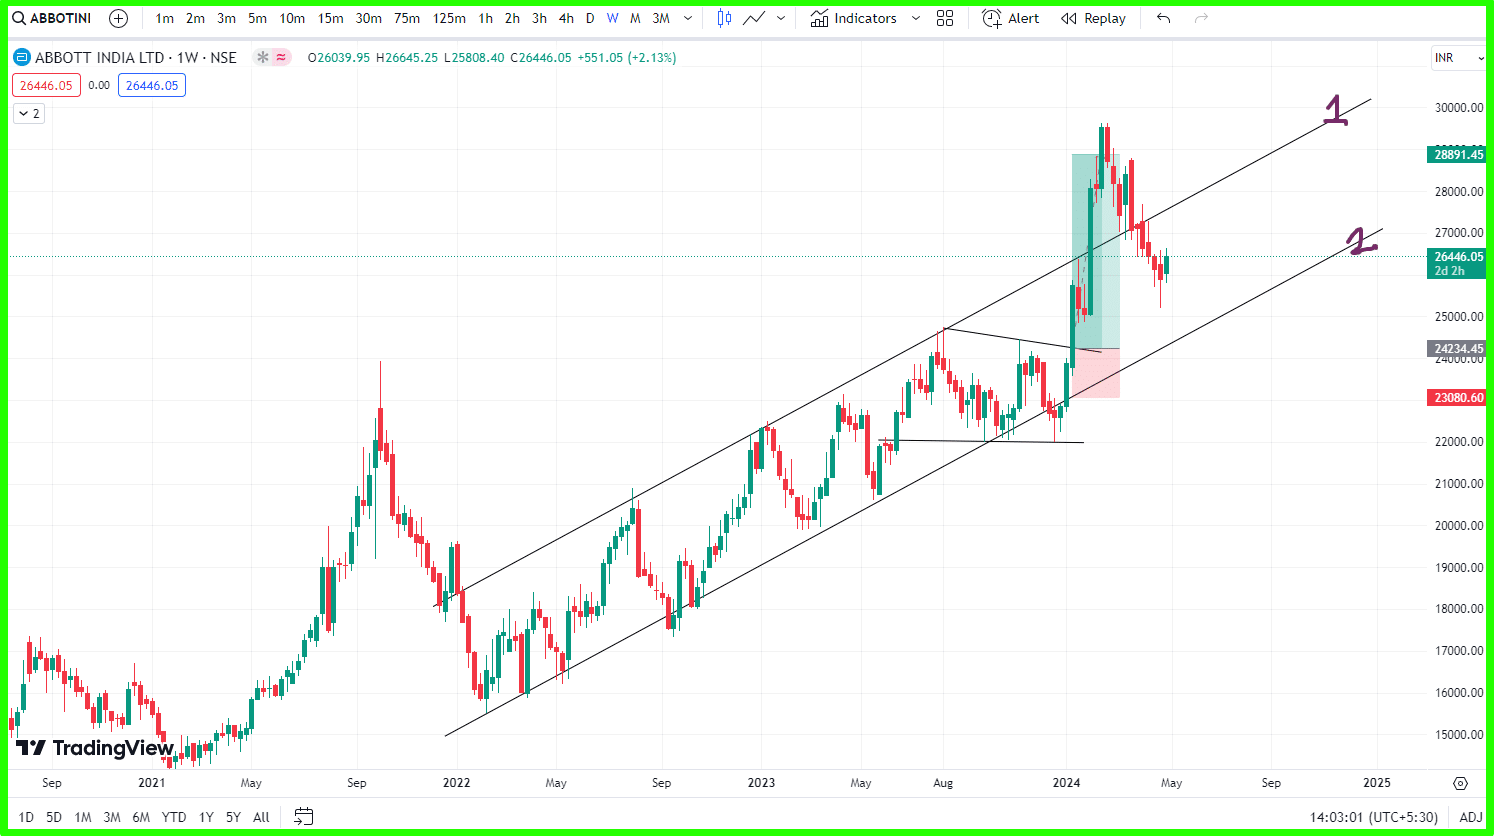
Friends also see can above image and first I tell you how I found this stock first I found the channel pattern on time Prem like that monthly weekly. After that market went upside on the big time frame and I find this pattern on a daily time frame also you can see the Red Line breakdown but I do not take entry there because if it breaks then you will not get a huge target because the big time frame is bullish so I find bullish pattern and then you can see the result how much big target you get.
Read Also This
–Tata Motors Share Price Target
–Adani Power Share Price Target
-Adani Total Gas Share Price Target
-Reliance Power Share Price Target 2030
How to find Best price action chart patterns pdf
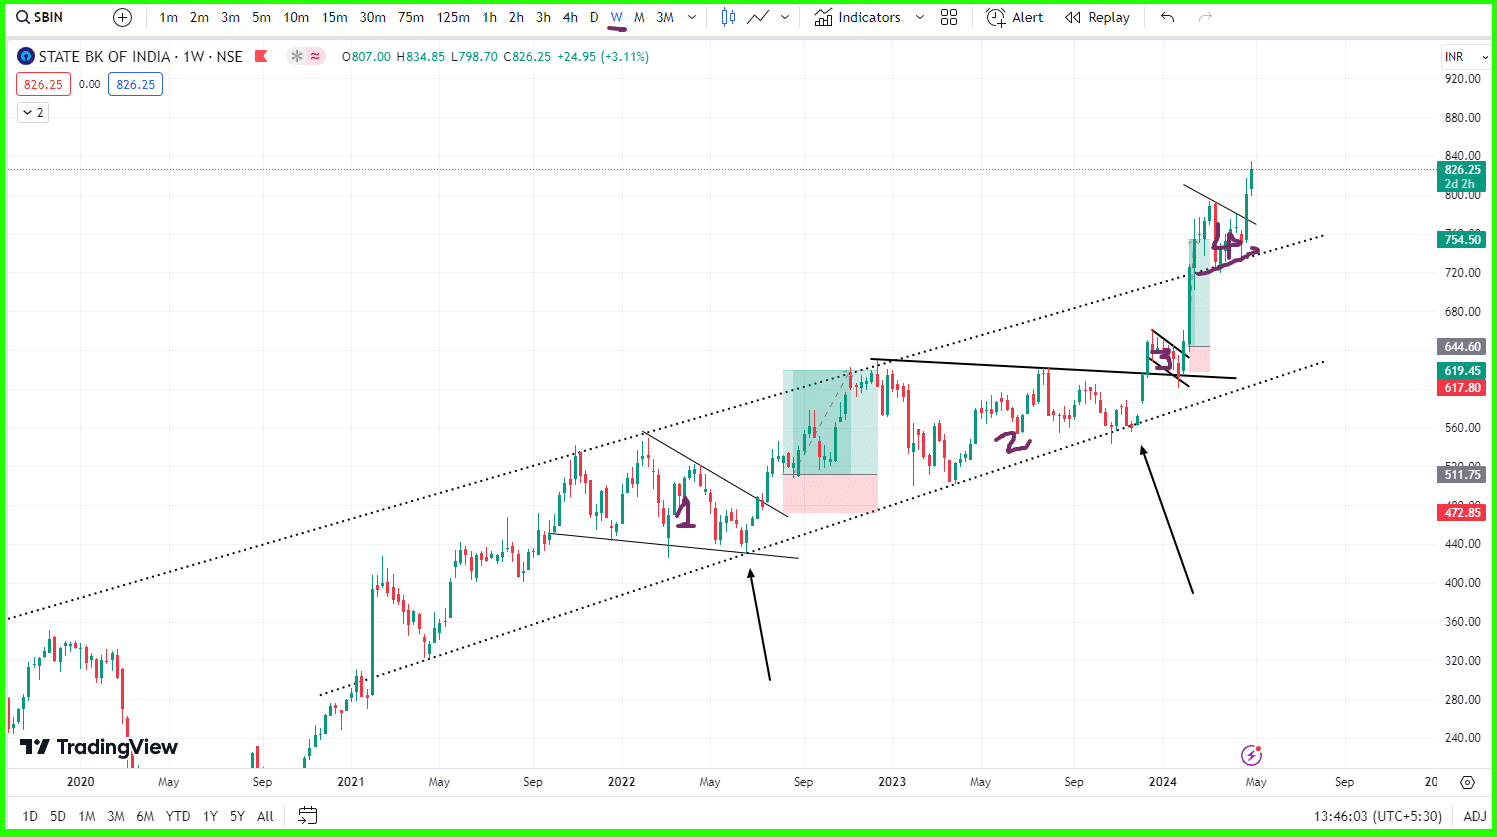
see the above image in this image on the weekly basis I draw a trendline channel in dotted line and in that way market going upside and in upside find bullish pattern they will gives you best result.
See the above image in this chart I draw a trendline on a weekly basis you can see how the market going upside then you can try to find stocks in this upper trend bullish on a small time frame. if you find the best pattern in this bullish trend on a big time frame then you will get many patterns that will give you huge returns in these stocks.
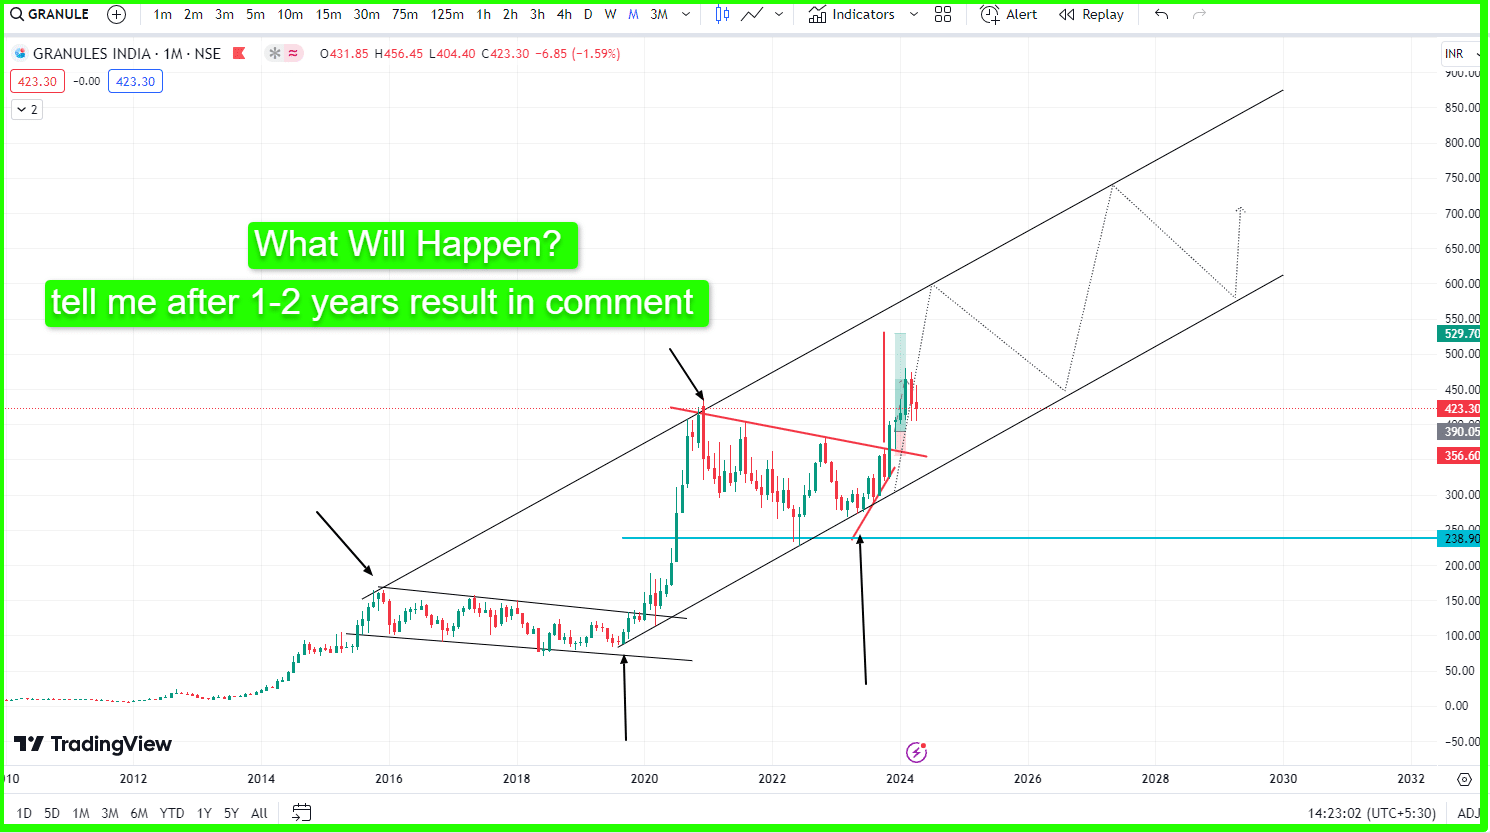
the above image you can see in this image on monthly time frame it became channel pattern in future you will lots of opportunity so wait and find it on small time frame like daily weekly.
Faq
most profitable chart patterns pdf
Triangle pattern channel pattern
Price action chart patterns pdf in hindi
yes in this article you will get details Price action chart patterns pdf