

In this article, we will see the topic best solar stocks in India to invest in 2024. also the best solar energy stocks in India which will give good returns in the future. The best solar stocks to invest in India list will be here also. The best stocks in solar energy in India to invest we will see here in detail.
Best solar stocks in India to invest in 2024 |
Solar Energy Stocks List in India
| No | Best solar stocks in India | Best solar stocks share price |
| 1 | Tata Power Company Ltd | 437 |
| 2 | Adani Green Energy Limited | 1807 |
| 3 | Suzlon Energy Ltd | 41.6 |
| 4 | KPI Green Energy Ltd | 2004 |
| 5 | Urja Global Ltd | 22.1 |
| 6 | Rec Ltd | 457 |
1. TATA Power Company Ltd-Best solar stocks in india
Tata Power Company Limited is listed on the National Stock Exchange and the Bombay Stock Exchange. Tata Power is engaged in the business of power generation Power Transmission and distribution of electricity. Tata Power company also manufactures Solar roofs and plans to build one lakh heavy charging stations by 2025.
Tata Power BSE 500400 and Tata Power Nse:TATAPOWER.Tata Power is in the sector of power generation & Distribution.
Read Also This
–Tata Motors Share Price Target
–Adani Power Share Price Target
-Adani Total Gas Share Price Target
-Reliance Power Share Price Target 2030
TATA Power Company Ltd- Fundamental Details
| Metric | Value |
|---|---|
| Market Cap | ₹ 1,39,604 Cr. |
| Current Price | ₹ 437 |
| High / Low | ₹ 444 / 199 |
| Stock P/E | 40.8 |
| Book Value | ₹ 94.3 |
| Dividend Yield | 0.46 % |
| ROCE | 11.7 % |
| ROE | 12.6 % |
| Face Value | ₹ 1.00 |
| Sales growth 3Years | 23.7 % |
| EPS | ₹ 11.2 |
| Debt to equity | 1.74 |
| OPM 5Year | 15.9 % |
| Int Coverage | 2.09 |
| PEG Ratio | 0.91 |
| Pledged percentage | 0.00 % |
| Return over 1year | 117 % |
| Promoter holding | 46.9 % |
| Profit Var 5Yrs | 44.9 % |
Tata Power Shareholding Pattern
| 2023 | 2024 | |
| Promoters | 46.86 | 46.86 |
| FII | 9.45 | 9.44 |
| DII | 14.16 | 15.47 |
TATA Power Company Ltd-Technical Chart
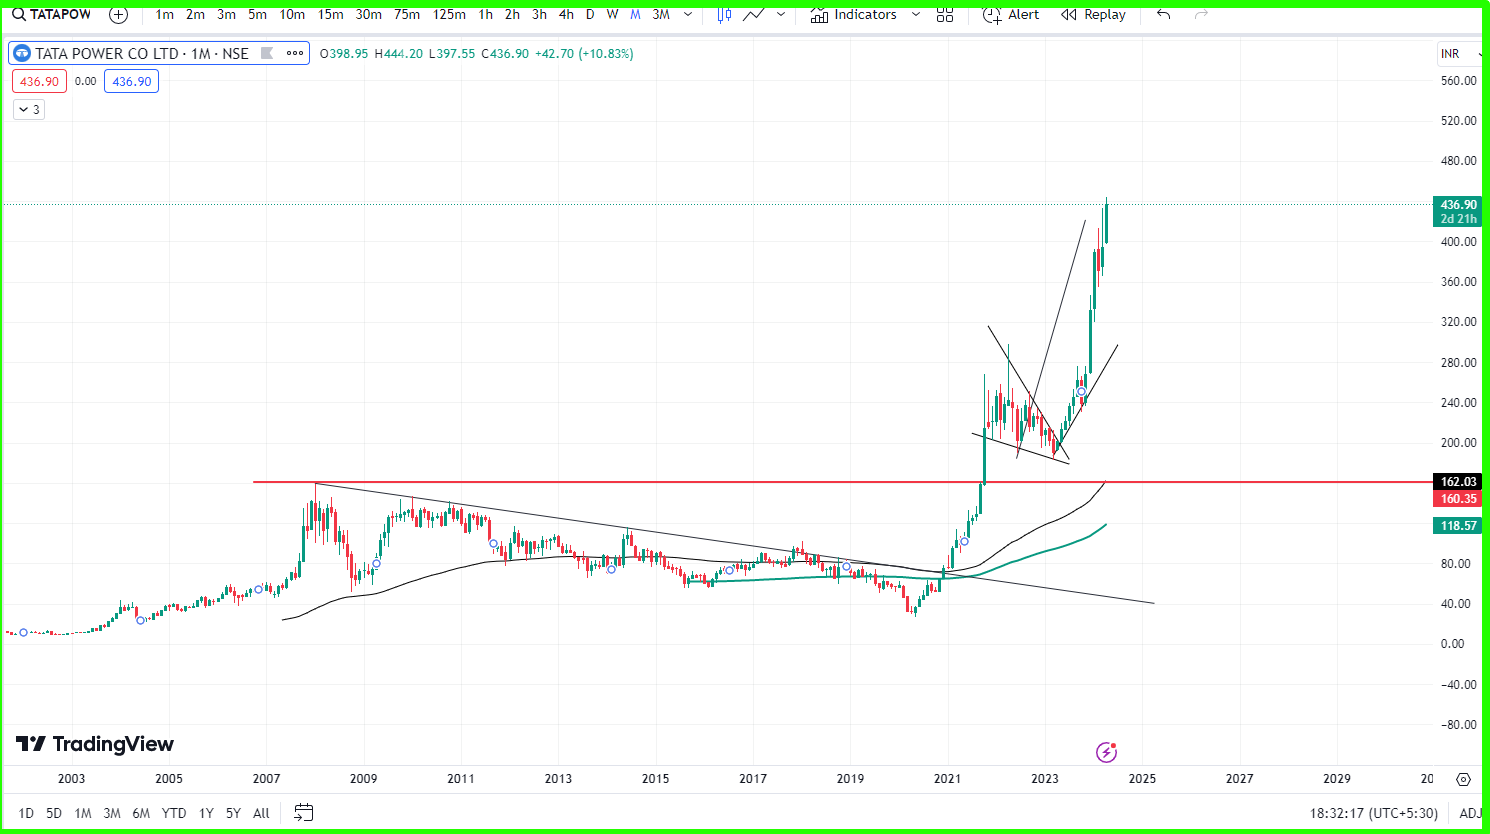
The above chart is Tata Power Company Limited Technical Chart this chart is monthly basis. Hindi chart eye draw a red horizontal line after break these horizontal line then stock use very huge moment but these horizontal line I draw talk made high near by 2007 to 2009 and this high break after 2021 and you can see that how much returns you got after break this long time I break. But now return to the investors so that if you thinking to invest in the stock it’s not a good opportunity because it already so that it then much more investor will try to book the profit who invested at low price. So try to wait this talk this stock comes down at a favourable price means near by moving average and then try to invest in Tata Power share Limited.
2.Suzlon Energy Ltd-Best solar stocks in india
Suzlon Energy Limited is listed on National Stock Exchange and Bombay Stock Exchange. Suzlon Energy is generally engaged in manufacture wind turbine generator and its related component.. Suzlon Energy is include in electric equipment industry and its sector is capital goods electrical equipment.
| Metric | Value |
|---|---|
| Market Cap | ₹ 56,201 Cr. |
| Current Price | ₹ 41.6 |
| High / Low | ₹ 50.7 / ₹ 7.90 |
| Stock P/E | 114 |
| Book Value | ₹ 2.53 |
| Dividend Yield | 0.00 % |
| ROCE | 20.8 % |
| ROE | % |
| Face Value | ₹ 2.00 |
| Sales growth 3Years | 26.2 % |
| EPS | ₹ 0.53 |
| Debt to equity | 0.04 |
| OPM 5Year | 5.82 % |
| Int Coverage | 3.45 |
| PEG Ratio | 6.65 |
| Pledged percentage | 0.00 % |
| Return over 1year | 402 % |
| Promoter holding | 13.3 % |
| Profit Var 5Yrs | 17.1 % |
Suzlon Energy Shareholding Pattern
| 2023 | 2024 | |
| Promoters | 14.50 | 13.28 |
| FII | 7.64 | 19.57 |
| DII | 5.55 | 6.30 |
Read Also This
–Tata Motors Share Price Target
–Adani Power Share Price Target
-Adani Total Gas Share Price Target
-Reliance Power Share Price Target 2030
Suzlon Energy Ltd-Technical Chart
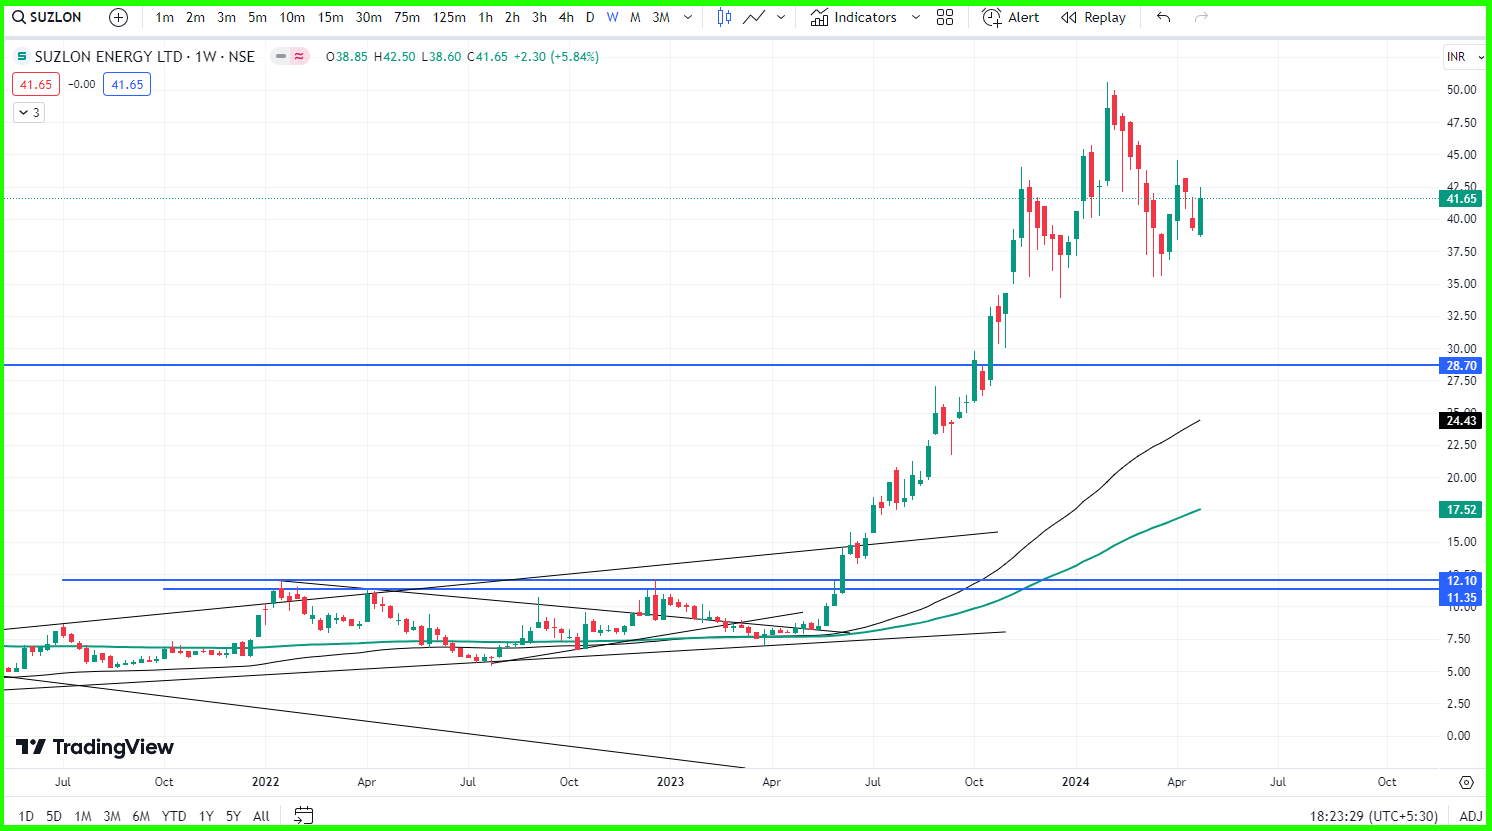
The above chart is Suzlon Energy Limited stock Technical Chart this chart is weekly basis. Hindi chart you can see that I draw to blue line horizontal and after this horizontal line break Suzlon Energy stock views very huge Returns. And now stock made high rupees 50 after 2023. But now you can see there are two moving average and from this moving average current price of Suzlon Energy share is far away so that if you thinking to invest in Solar Energy Limited stock you need to wait for some correction or some crash in this stock then you will get good operation a day to invest in this Suzlon Energy stock.
3. URJA Global Ltd-Best solar stocks in india
Urja Global Limited is listed on National Stock Exchange and Bombay Stock Exchange. Urja global Limited share price today is 22.1 and global share gives return over 1 year is 182%. Promoter holding of Urja global limited share is 19.4%. Book value of Urja Global limited share is 3.3 rupees. Urja global is engage in the business of renewable energy developer and operator.

You can see about artist Urja Global share Technical Chart weekly basis in the chart I draw a train line and from the straight line market goes upside but now market is coming down to the moving average so when market comes to the trend line support and also take support of moving average then it’s a good opportunity to invest in this talk so right now you have to wait for the good opportunity to investing Urja Global share.
| Metric | Value |
|---|---|
| Market Cap | ₹1,161 Cr. |
| Current Price | ₹22.1 |
| High / Low | ₹41.8 / ₹7.50 |
| Stock P/E | 470 |
| Book Value | ₹3.30 |
| Dividend Yield | 0.00% |
| ROCE | 1.55% |
| ROE | 0.89% |
| Face Value | ₹1.00 |
| Sales growth 3Years | -37.7% |
| EPS | ₹0.05 |
| Debt to equity | 0.03 |
| OPM 5Year | 0.42% |
| Interest Coverage | 4.37 |
| PEG Ratio | 15.5 |
| Pledged percentage | 0.00% |
| Return over 1 year | 182% |
| Promoter holding | 19.4% |
| Profit Var 5Yrs | 30.3% |
FAQ Best solar stocks to buy in India
Which are the best solar stocks to buy in India?
Tata Power is also good stocks
What is the best solar company to buy stocks?
Tata Power is also good stocks
Which energy share is best in India?
Tata Power is also good stocks
Which is India’s no. 1 solar brand?
tata power adani green